Other modes of transportation (i.e. bus, cycling, walking, etc.) should also be considered in the study. However, due to multiple extenuating factors, including time frame and existence of data, only two modes - subway and ride-hailing - were included.
Prediction of Mode Shift in New York City
Motivation
With the introduction of shared mobility services and the promise of autonomous vehicles, little is known about any anticipated changes in consumer mode preferences for urban mobility services resulting from shifts in affordability and accessibility. This is particularly true for understanding the impact to ridership of public transit systems across the United States, which are seeing declines in ridership while app-based ride hailing services are experiencing rapid growth.
Scope
This study focuses on understanding the commuter hour (6:00 AM to 10:00 AM) ridership trends of subway and app-based ride-hailing services (specifically Uber) and features that influence them. New York City was chosen as the initial city for the project due to the richness of data. While there are still shifts occurring in market share for both Uber and subway, most parameters have remained constant suggesting the system is not in equilibrium after the disruption of Uber. In order to understand and predict outcomes in the event of a price shift, both the longitudinal forecasting (without changes in features) and a cross-sectional study (features influences at a fixed point in time) need to be studied and incorporated into a model.
Objectives
Below are the questions framed from three different perspectives that this project aims to answer.
City
Is an increase in ridership of ride-hailing services negatively impacting public transit ridership?
How should the city respond from a policy and planning perspective?
Citizen
What factors contribute most to the mode choice?
Companies
Where and what kind of trips does Uber have a market advantage over other modes?
Is there a capacity constraint in the growth of ride-hailing services?
Limitations
Public ride-hailing data was only made available in 2015 which restricted the analysis to start from that timeframe. The disconnected subway ridership information provided also prevented working with a finer granularity.
There are many factors that simply cannot be included in the model, because we do not yet understand what may happen to the overall system from a policy or operations perspective. Thus, any form of prediction will only be valid for the immediate future.
Different spatial granularities required aggregation of data across spatial boundaries via establishing of weightings. While this may provide an estimate, it cannot accurately determine features across different spatial boundaries.
The project timeline and API request quota limited the collection of cost and duration data to only a few weeks which could potentially make the model built biased due to sparse representation of trends.
Results
Ridership Trends
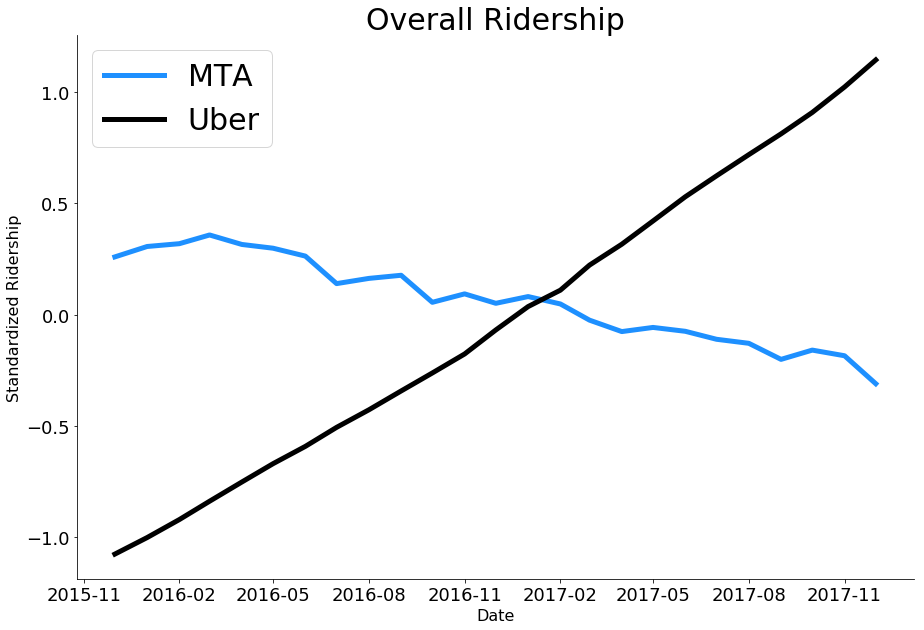
The ridership trends for Uber and Subway were visualized across various time aggregations in order to understand the longitudinal nature of ridership given that most relational features were presumed to be constant over the time period to better understand how they are expected to shift without any policy or operational changes. It is interesting to see how subway ridership is trending slightly downwards, however, when isolated during commuter hours, ridership appears relatively stable.
Ridership were also plotted spatially to understand how the trends change in different taxi zones. Regardless of time aggregation, subway ridership remains relatively constant with slight seasonal shifts. Uber ridership sees major increases, particularly in the outer boroughs (Canarsie, East New York, Jackson Heights etc.), which potentially indicates an increase in first and last mile trips and a possible complementary relationship to the subway.
Use the menu below to see changes across different time aggregations.
Time
Origin Dashboard
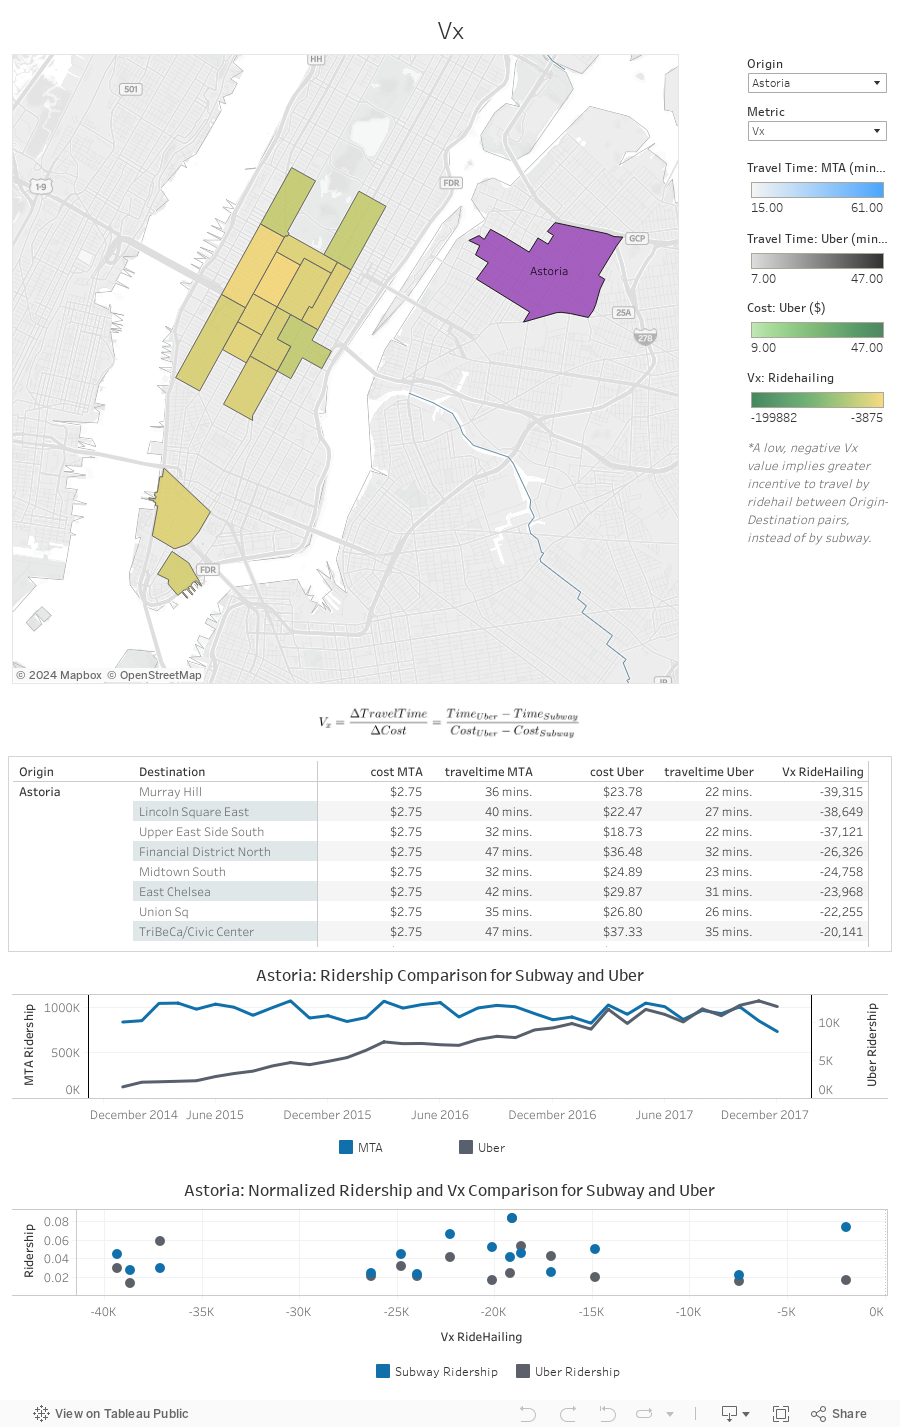
As part of understanding ridership trends, the team attempted to build a specific variable to account for Value Experience (including cost and travel time) to provide a simple, exploratory way to understand where different modes have specific value-adds to riders.
Explore the Value Experience (Vx) metric across different origin-destination pairs through our dashboard. Simply select an origin and related destination zones will be highlighted with the corresponding Value Experience for that route. A negative value for Vx implies a greater incentive to travel by ride-hail rather than the subway, and vice versa a positive value indicates greater incentive to travel via subway rather than ride-hailing.
A comparison of the subway and Uber commuter hour ridership is also available at the bottom of the dashboard. Note that the scales of the ridership for the two modes are quite different, but this graph will provide insights on the complex relationship of the two modes.
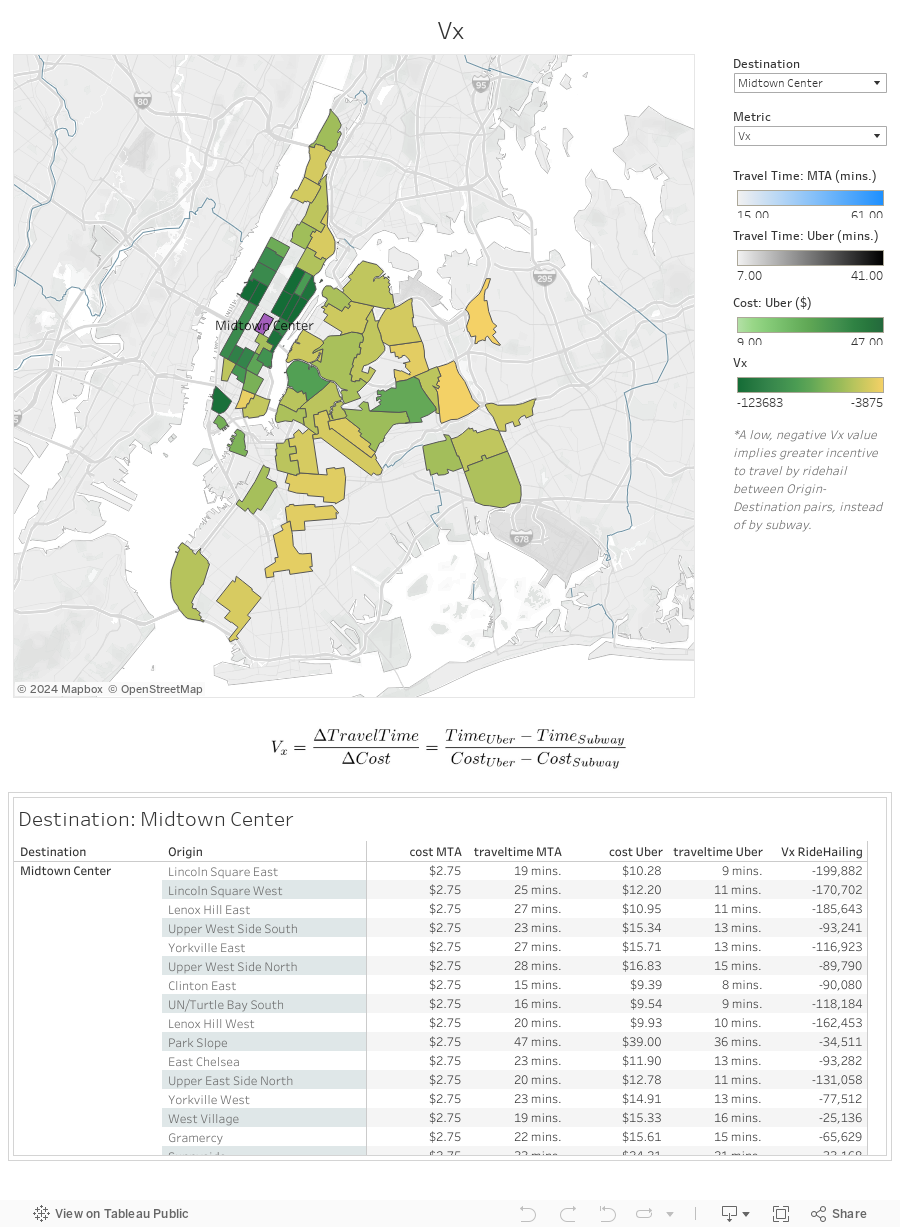
Destination Dashboard
Explore the Value Experience (Vx) metric across different origin-destination pairs through this dashboard. Simply select a destination and related origination zones will be highlighted with the corresponding Value Experience for that route. A low value for Vx implies a greater incentive to travel by ride-hail rather than the subway.
Predictive Model
Using a combination of value-based and customer sentiment features per origin-destination pair and socio-economic features per origin, a random forest model was trained to predict the ridership of both subway and Uber if there were changes to the operating model of Uber service in anticipation of the introduction of autonomous vehicle fleets. This was simulated by reducing the cost of Uber at different rates.
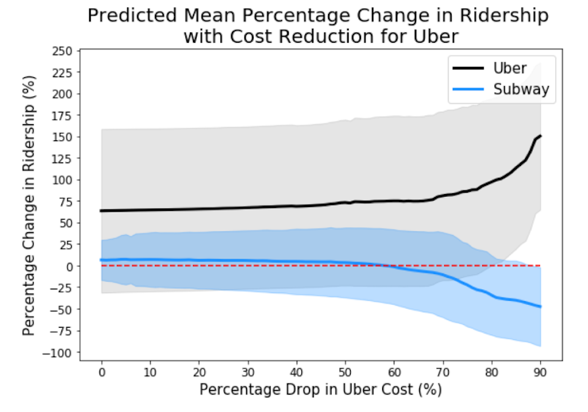
While the model indicated high performance with an R2 of 78%, there were some surprising results and a large distribution of ridership figures that did not necessarily make sense particularly with a 0% change to cost. This is shown spatially in the figures below, however it is interesting to note that there are clear outliers and predictions that are not valid, with some Subway areas indicating a massive increase in ridership and similar trends in Uber ridership with outrageous values for percentage increase. This is attributed to the OD pair selection of the model that may bias any results due to a limited number of mostly high ridership pairs being selected as well as the large disparity between Uber ridership and subway. Despite this, it is clear that subway is only significantly impacted by Uber changes in cost with a substantial (60%) shift in price.
Conclusions
Is an increase in ridership of ride-hailing services negatively impacting public transit ridership?
While subway ridership may be down, inconsistencies in the trends of subway ridership in specific zones show that it cannot be exclusively attributed to the presence of ride-hailing services during weekday commuting hours.
What factors contribute most to mode choice?
Cost, travel time, distance and comfort are the major features that influence ridership.
How should the city respond from a policy and planning perspective?
Planners and transit agencies need to keep investing in services and expansion of existing networks to ensure that they maintain standards and performance, if they wish to remain as the main service providers for people.
Is there a capacity constraint in growth for Ride-Hailing Services?
As a system, Uber is still unstable since the service is still in its early stages. However, looking at the trends of specific zones already show a certain level of saturation. This begs the question of when will Uber reach equilibrium with other modes of transportation and will an anticipated drop in cost due to automation materialize before the system reaches equilibrium?
Where and what kind of trips does Uber have market advantage over other modes?
Among the origin-destination pairs analyzed, the value experience indicates that there is an incentive in taking the subway for routes that do not require transfers and an incentive for Uber for shorter routes. In its current state, Uber may not be able to attract ridership from the subway for those trips. However, this might change in the event of a significant shift in the cost of Uber.
Data Sources