CENTER FOR URBAN SCIENCE AND PROGRESS
AUTOMATED FEATURE DETECTION FROM PROPERTY IMAGERY DATA


ABOUT THE PROJECT
MOTIVATION
Automated tax valuation models utilize individual building features to estimate a home’s value and subsequent tax liability. The records that the New York City Department of Finance (DoF) has that document the features used for tax assessment for each house currently have no quality assurance checks apart from in-person inspections done by visits to each individual home. Desktop review of high resolution street level images is an effective replacement for on-site inspections, but still requires manual labor, which, multiplied over the more than 1 million parcels in the DoF’s jurisdiction, poses a large drain on resources.
SCOPE
We want to test the feasibility of an automated approach of home-feature screening. Automated home-feature detection is a scalable technique, but it is only worthwhile if it is effective. Therefore, we must prove the feasibility of this approach by training an accurate home-feature image classifier. The other goal of this study is to compare the performance of classifiers with training images of varying quantities and qualities. While image classifiers perform best when trained on a large volume of high quality images, labelling those training images is another resource cost, and requires the desktop review that this approach is meant to replace. In theory, the DoF already has labels for every address, since they have a library of features for every house. Although some of those labels are wrong, we test the performance cost of using these “noisy” labels as training labels.
DATA
One, two and three family dwellings imagery data were needed to train the classifier to identify particular building features. A library of building images was acquired by scraping individual building images from Google Street View. The DoF currently has 13 building physical characteristics that need to be reviewed for tax valuation purposes. Building proximity was chosen as the target variable for the identifier feature. Building proximity is the distance between each building, whether it is attached/abutted (i.e. both sides of the building are touching or sharing a wall with a neighboring building), semi-attached (i.e. only one side of the building is touching the side or sharing a wall with a neighboring building) or detached/freestanding building. The proximity label for training and test data is obtained from NYC PLUTO data. However, PLUTO label is not 100% correctly labelled. In addition to the PLUTO data, the DoF provided the results of their desktop review, a dataset containing 2,520 screened addresses that gave the base of valid ground truth label for training the classifiers.
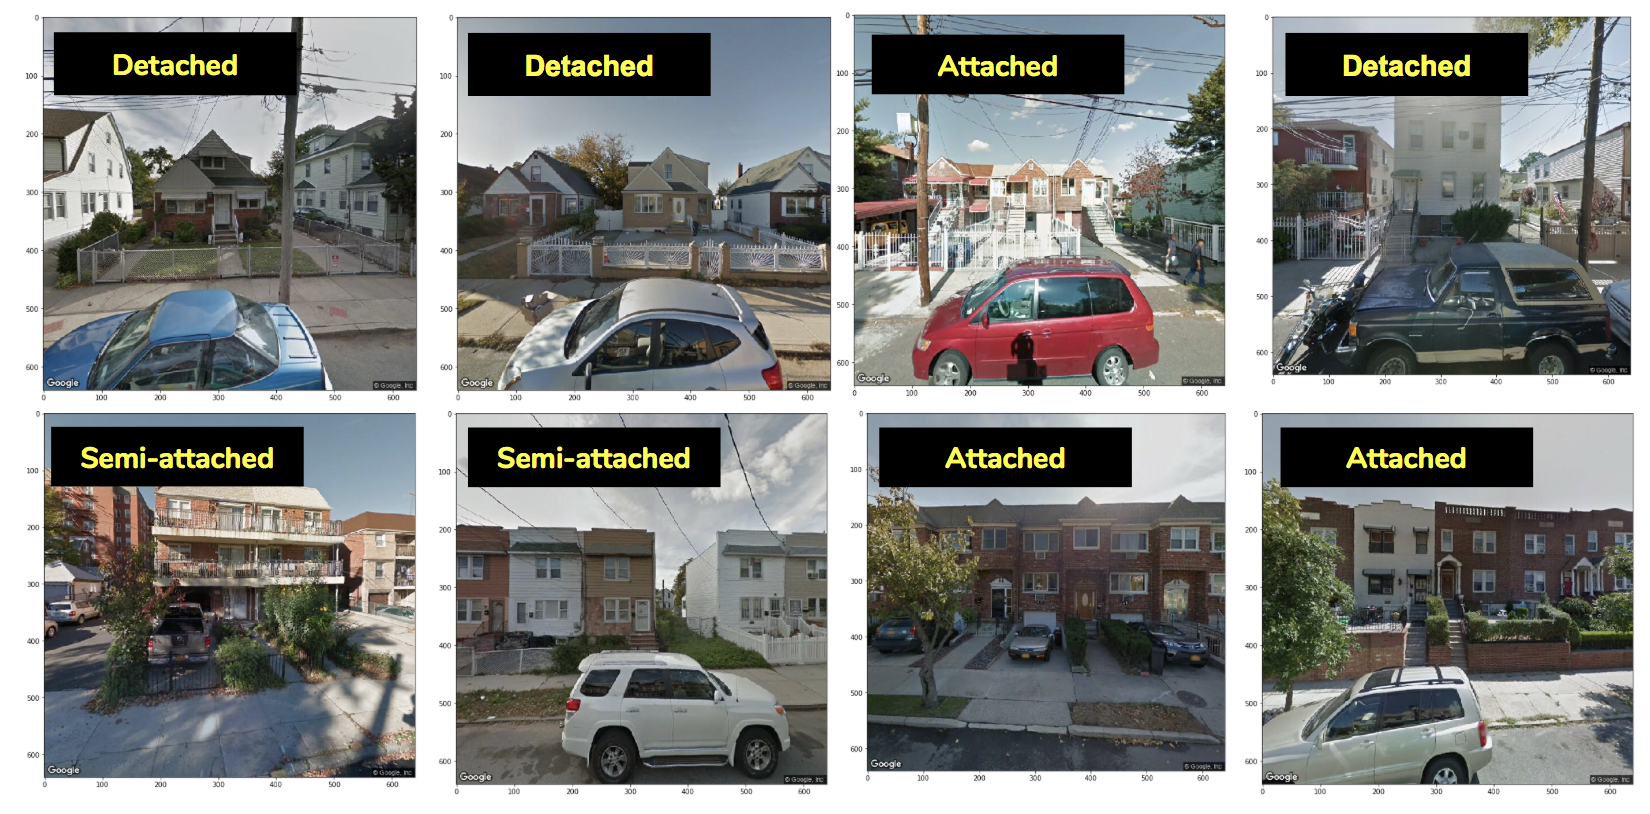
Example of the different proximity features
METHODOLOGY
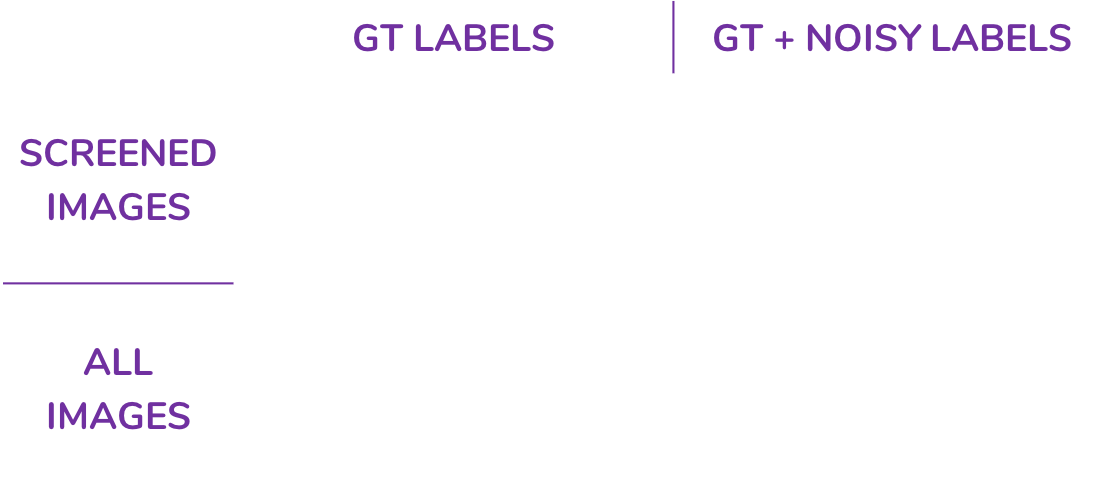
The overall objective of the methods was to train a classifier that can correctly identify the proximity class of a building. We achieved that by training four image classifiers, each with different quality and quantity of training images and training labels. The first classifier (C1) was trained on the best quality of images and labels, which is the DOF ground truth data that free from any unusable images. The C2 classifier was trained on all of the ground truth labels, which included the unusable images where the house was not visible. C3 was trained on all the available images with over 240,000 images, including the noisy images. The C4 was trained on all available images which has been screened from noisy labels using automated screener. All four classifiers were trained on Convolutional Neural Networks.
Additionally, we trained a baseline classifier using only the structured data (ie. the other building features associated with each address) to predict the correct proximity class. The baseline was trained only on structured building features, which were obtained from the PLUTO dataset. The PLUTO data consist of 84 features of geographic data from various land use classification. For predicting the building proximity, we selected nine features that are available for 1,2,3 family buildings. The features are borough, community district, building class, residential floor area, building frontage, building depth, availability of extension or free-standing structure, basement category, and when the building is built.
The image classifiers and the baseline were assessed on their performance on a test set at two tasks: proximity class detection (herein referred to as classification) and the erroneous label detection (herein referred to as ELD). In addition, the top two classifiers were externally validated on both the classification and ELD task.
DEMO
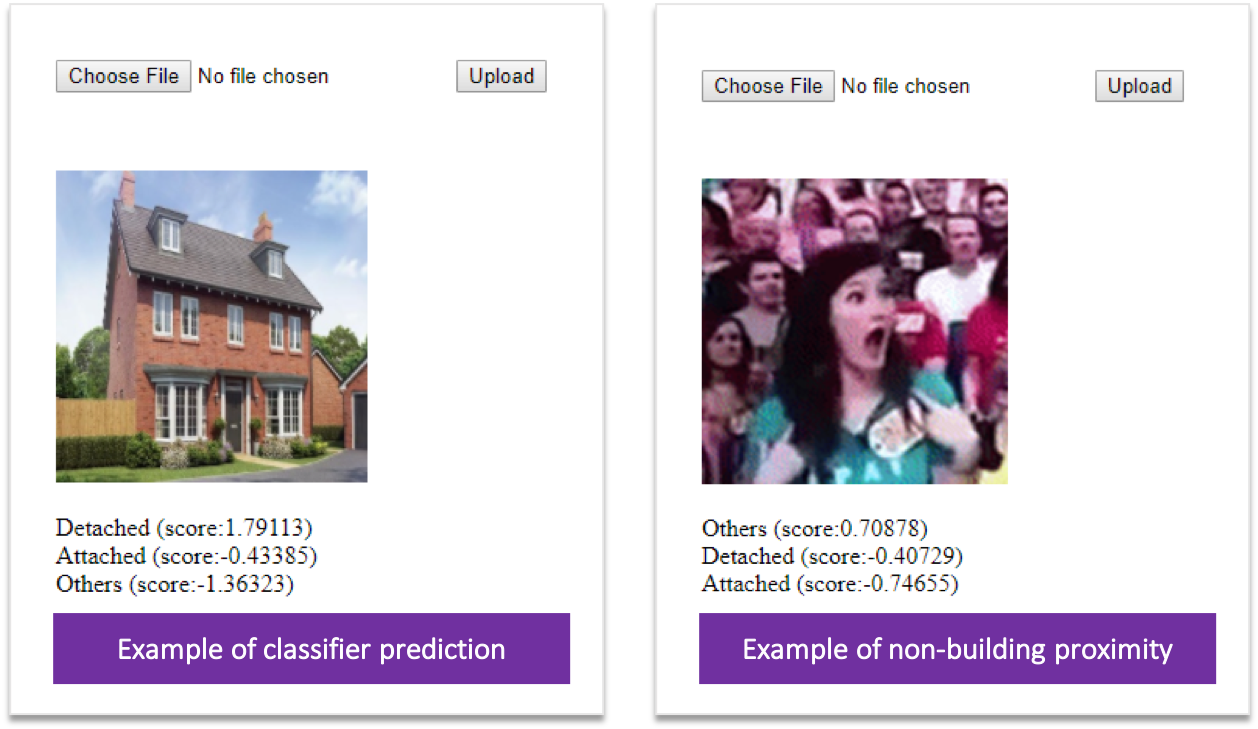
Example of prediction result
RESULTS
Four classifiers performance result
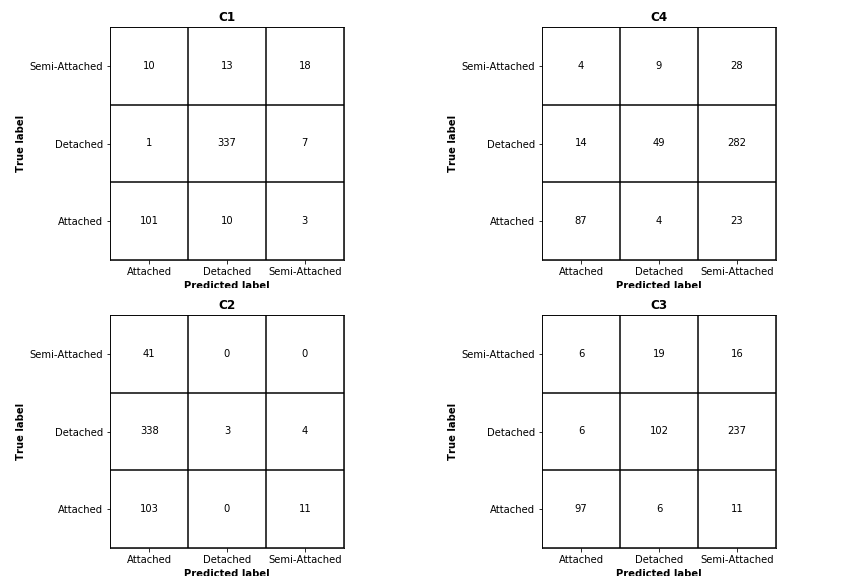
Four classifiers confusion matrices
From the results of the four classifiers, it is seen that C1 has an accuracy of 0.912 and an F1-score of 0.796 which is the best while C2 has an accuracy of 0.212 and an F1-score of 0.347 which is the worst. C3 and C4 have similar scores. Additionally, C1 is the only one that outperforms the baseline classifier while the others are all worse. What's more, from the confusion matrix, we can see that the "Semi-Attached" is the most incorrectly labeled class for all of the classifiers.
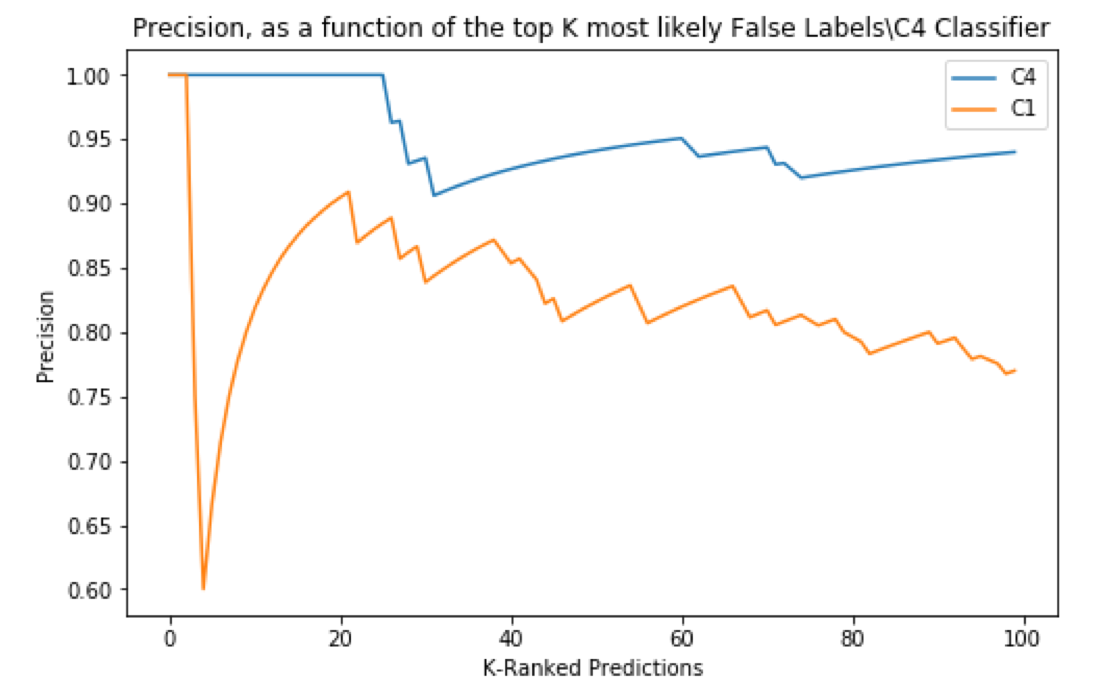
External validation performance
A perfectly performing erroneous label detector would present in this graph as a horizontal line at a precision of 1. C4 clearly outperforms C1, when considering the precision curve. The top 20 most likely to be labeled erroneously, were in fact mislabeled, as shown by the precision of 1 for the first 20-K ranked predictions. C1 shows a large drop-off, indicating that for several houses, it was very confident that they were mislabeled when in truth, they had valid labels. As C1’s confidence decreases, so does its precision, as shown by the gently downward sloping curve. C4 also loses precision as its confidence declines, but a slower rate (as indicated by the flatter slope of the curve). This indicated that on the external validation, C4 is more successful at its job of detecting erroneous labels.
CONCLUSION
Our goal in this project is to explore the possibility of using computer vision classification to determine building features for tax mapping purposes. Based on the results of the external validation, the image classification is an effective tool for highlighting properties in the DoF portfolio that are likely to have an erroneous label that is in need of correcting. This demonstrates that an image classifier, such as the C1 classifier, can improve the desktop review process by prioritizing properties in need of label correction.
The other goal for the project is to explore the classifiers performances with limited validated labels. We constructed four classifiers with various combination of the screen labels, noisy labels, screened images and noisy images. Our classifiers with ground truth labels and screened images outperform our other models by a large margin. So as our preliminary results demonstrated, the quality of labels and images are more important than the volume of the training sets in our classification problem.


Copyright © NYU CUSP 2018 | Design: Kinetic