


Public Transport plays a crucial role in cities by providing access and mobility to its inhabitants. Disruptions to the system can lead to major delays with far-reaching impacts. Building on prior research on transport network vulnerability in New York City, we assess the impact of network disruption through a study on 5 cities worldwide: New York City, London, Singapore, Taipei and Washington, DC
Subway systems form the backbone of the city, ensuring the smooth functioning of daily activities. The scale of subway systems in these cities make them vulnerable to disruptions. Hence it is crucial for cities to anticipate repercussions to maximize the effectiveness of the system. While single node failure has been relatively well studied, disruptions on multiple nodes have been relatively unexplored. Our study is driven by the idea that simultaneous disruption on two stations may have more significant impact than the cumulative disruption on two separate stations, a situation likely to occur during a natural disaster or terrorist attack. We present the idea of synergistic effects, and by comparing network disruption in 5 cities, we uncover the patterns and universalities between subway systems worldwide
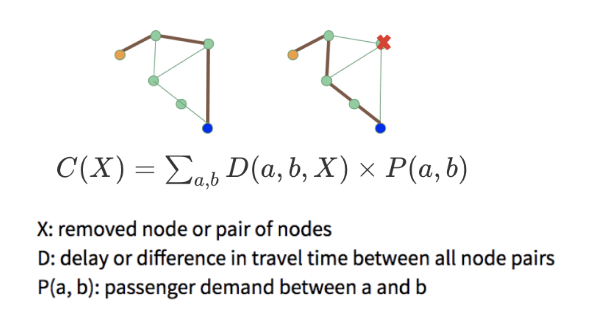
Criticality score is calculated by taking the sum of lost "passenger hours" under travel disruption.
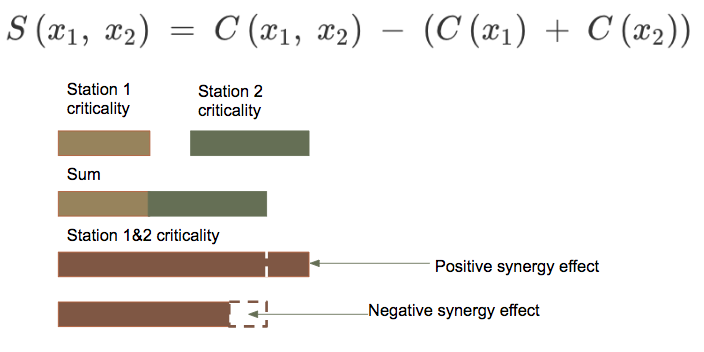
Synergy measures the effect of simultaneous paired disruptions by comparing the extent in whcih the criticality scores of paired disruptions differ from the sum of separate disruption on single nodes.
Using these two key ideas, we are interested in identifying stations with positive synergies, in which simultaneously paired disruptions have higher impact on the network compared to separate disruption on single nodes. This is the ’greater-than-the-sum-of-the-parts’ effect which will be of particular interest to urban planners and security analysts.
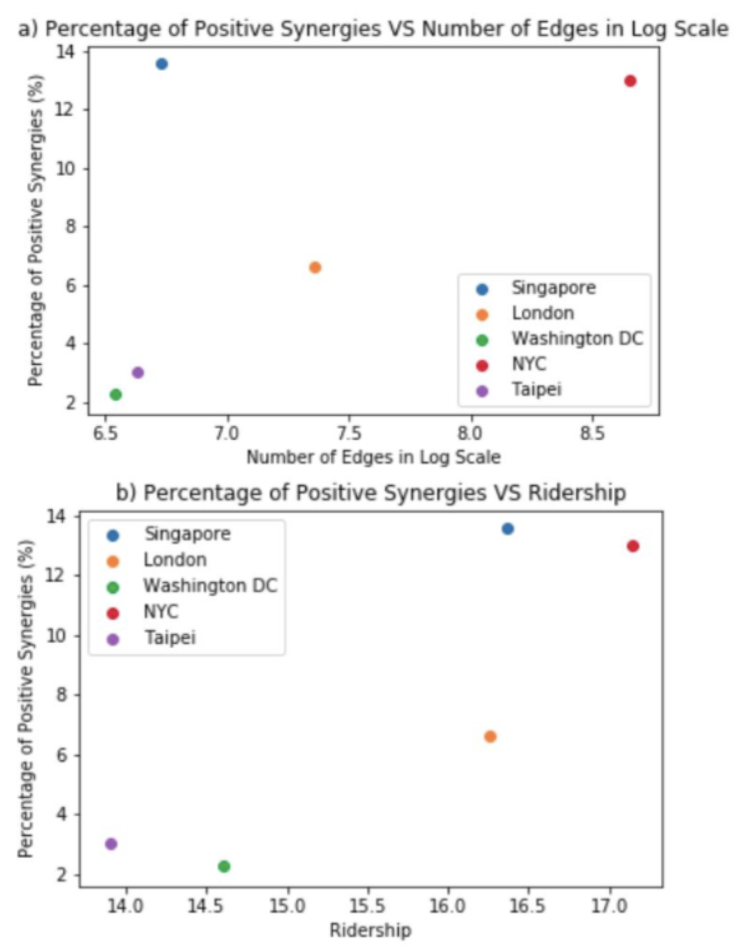
To explain the occurrence of synergies in the network, we examine both global and local patterns. First, we find that synergies are closely related to overall network complexity. In the figure, a) shows that the percentage of positive synergies increases as the number of edges in log scale increases, though with the notable exception of Singapore, which has the highest percentage of positive synergies despite it being a smaller network. The presence of Singapore as an outlier may be due to the relatively higher volume of ridership, as seen in b) where the percentage of positive synergies is observed to increase with ridership. This suggests that while synergies can be explained by complexity to a certain extent, other factors may be additionally important.
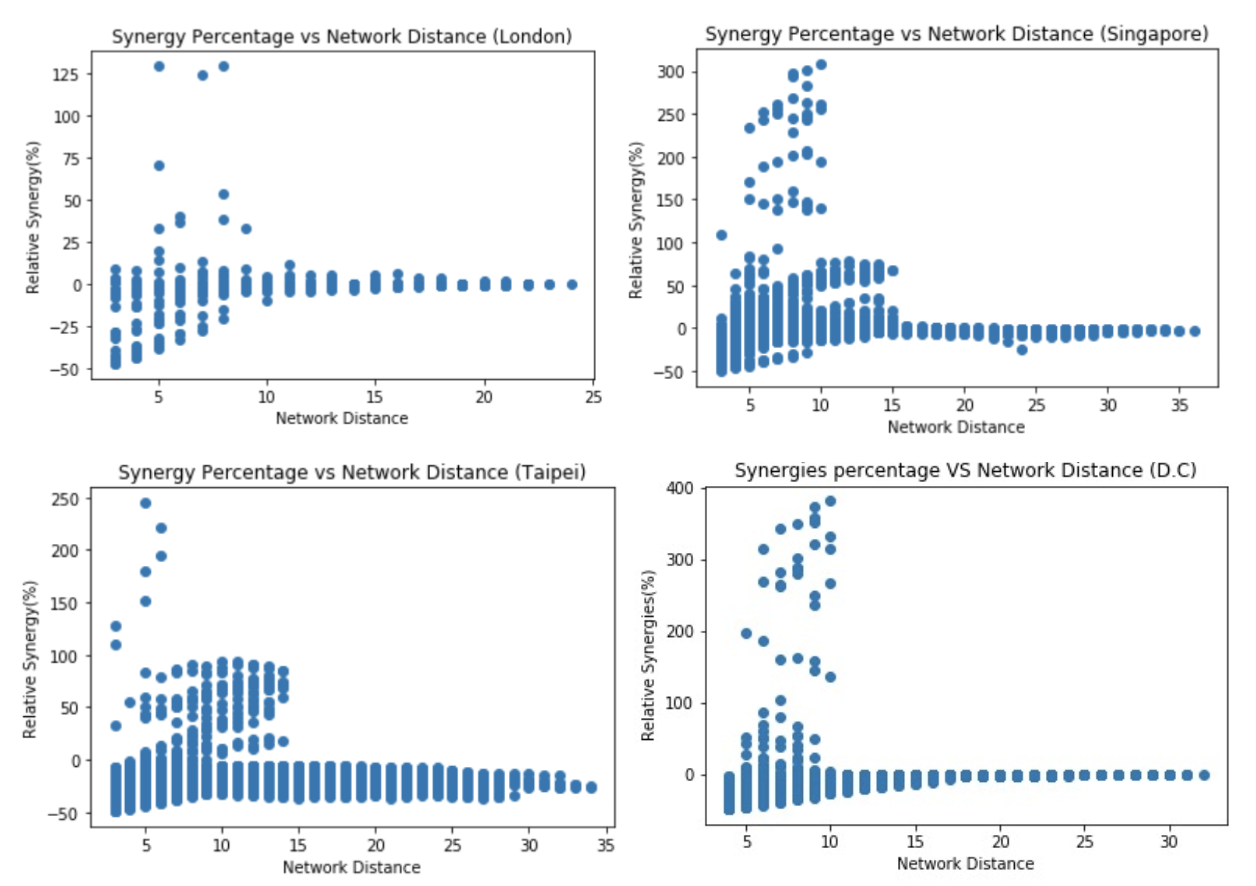
We find that, upon pair-node disruption, the percentage of relative synergies is related to the distance between the two stops. Station pairs with near-zero relative synergies are found between stations of any distance, while pairs with negative synergies are largely only found between stations less than 10 stops apart with the exception of Taipei. Interestingly, station pairs with exceptionally high positive synergies also only occur where distance is less than 10 stops.
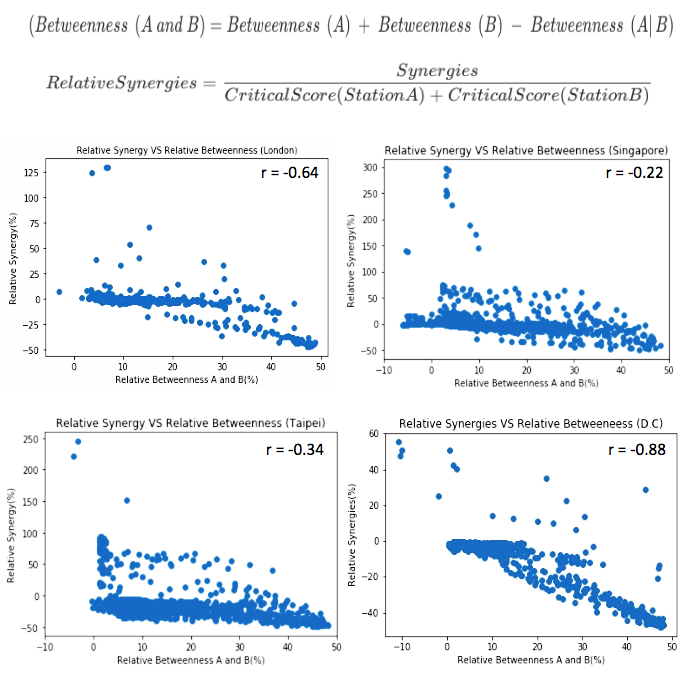
Betweenness centrality is based on the idea that a node is more central if it is traversed by a larger number of the shortest paths connecting nodes in the network. To encompass the demands of our question, we introduce a new measure of network distance: relative betweenness. Relative betweenness of two nodes refers to the relative size of an overlap in the sets of shortest paths. A large cluster of near-zero relative synergies can be observed in all cities, as can clear clusters of highly positive and negative synergies. There appears to be a negative relationship between relative betweeness and relative synergies in all cities, with relative betweenness decreasing as relative synergies increases. The relationship is strongest in Washington, DC with a correlation coefficient of -0.88 and fairly weak in both Singapore and Taipei; this may be due to the presence of clear outliers in these cities, in which a few stations have exceptionally high relative synergies. Nevertheless, this suggests that topology of the network is almost certain to be an important factor in explaining synergistic effects.
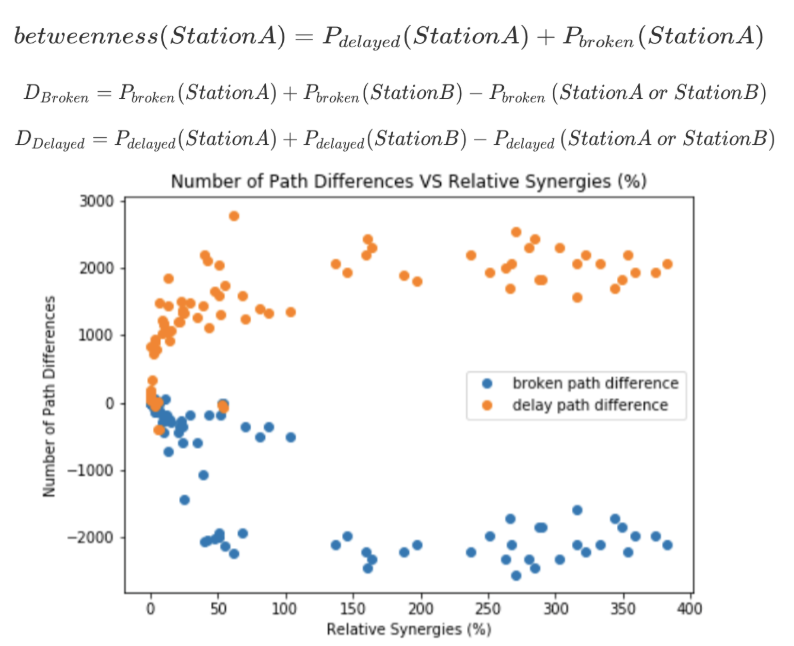
An in depth analysis was conducted for Washington, DC to understand where positive synergies occur in the network. The figure shows the relationship between broken-path and delay-path differences, revealing that for station pairs with relative synergies higher than 150\% (i.e. when synergistic effects exceed 1.5 times the combined criticalities for the respective nodes), the number of broken-path differences is negative; the number of delay-path differences is positive. This suggests that the initial single node disruption is converted to a broken-path, resulting in more significant impacts.
Our study of disruption effects in the transportation networks of five global cities provides insight into the nature of scaling and structure of subway systems across the globe with a focus on synergies produced by multi-nodal network disruptions. We uncover synergies which reveal the unique effects, differing considerably from the sum of the pairs, and lay the groundwork for further research into the universalities that certain transportation structures may contain. These insights, alongside the methodology used here, can provide urban planners and security agents with a quantitative framework through which to better design, expand, and protect urban areas. They can also be used by city agencies to prioritize maintenance and provide bolstered support during large events or in emergency situations. Origin-destination data is a critical factor in the construction of such networks, and is essential to conduct analysis. While many cities collect such data, others do not, or only collect portions of the total requirement. The development of a model for predicting flows may be used to estimate such flows, thus enabling approximate analysis in cities lacking such data. To provide a more rigorous analysis of what specific elements of scale and structure effect the synergistic nature of these disruptions, more data and further study is needed. However, we feel that the methodology and approach outlined above lays a strong foundation for future work.
Data retrieved from London Data Store includes Oyster card data containing individual entry and exit in the London Underground, station locations, and schedule information from the TfL live feed
Ez-link card travel data was obtained from the Land Transport Authority, access was granted for 2 weeks of data in January 2018. Station locations and schedule information are openly available online.
Easycard data is openly available from Data.Taipei, and Station locations and schedule information are openly available online.
Passenger flow data was retrieved from a public dataset on PlanItMetro and station information was retrieved from WMTA
Data and results obtained from previous capstone team, available on github
Alex Shannon, Fangshu Lin, Rachel Lim Xin Rong, Sunglyong Kim
We would like to thank our mentor Stanislav Sobolevsky for his guidance and advice throughout the capstone project.