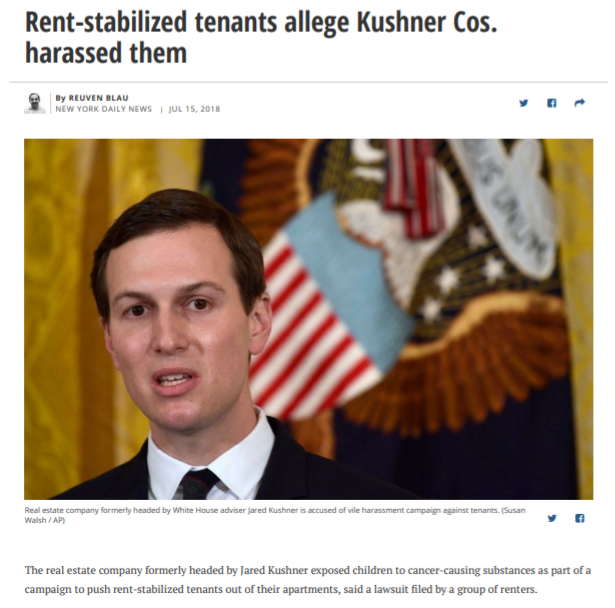
Bad landlord: Kushner
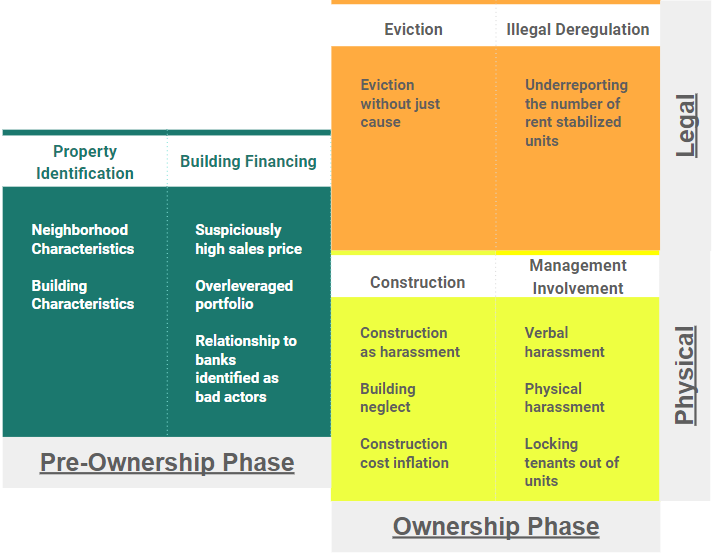 Process Diagram
Based on conversations with many stakeholders involved in tenant’s rights in New York City as well as a substantive review of literature and case law, our team built out a process diagram detailing actions undertaken by landlords at various phases in the property ownership cycle. We identified 6 critical types of actions that are taken by predatory landlords: identified are property identification, building financing, construction, building management involvement, legal proceedings, and illegal deregulation. While obviously not capturing all tactics of predatory landlords, this typology and the actions described in the process diagram provide the foundation for an analysis of predatory landlord behavior throughout the property ownership cycle.
To build out landlord portfolios, our team used the open source website WHO OWNS WHAT , an entity resolution tool using open data created by the JustFix.nyc team in collaboration with a group of civic hackers and non-profit stakeholders working on housing rights.
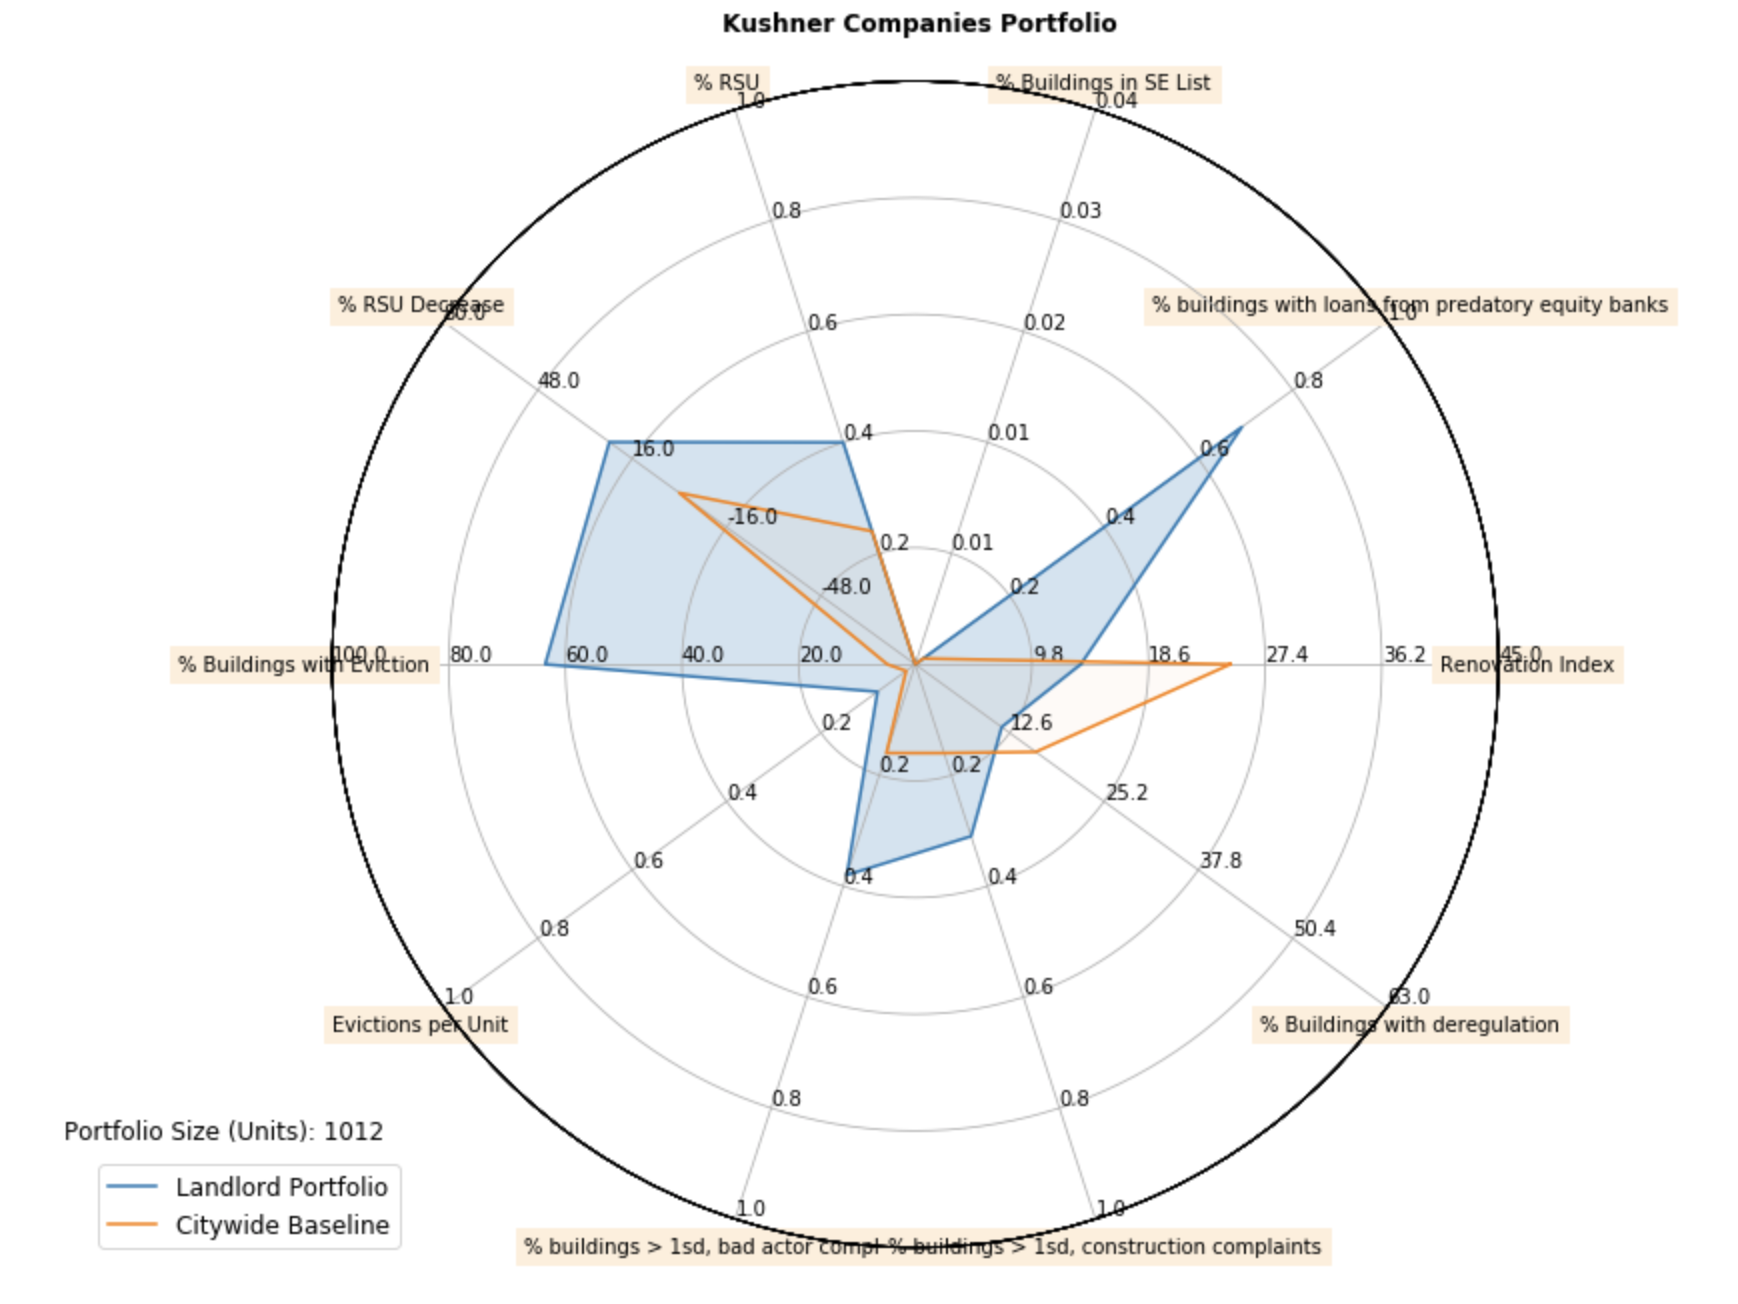
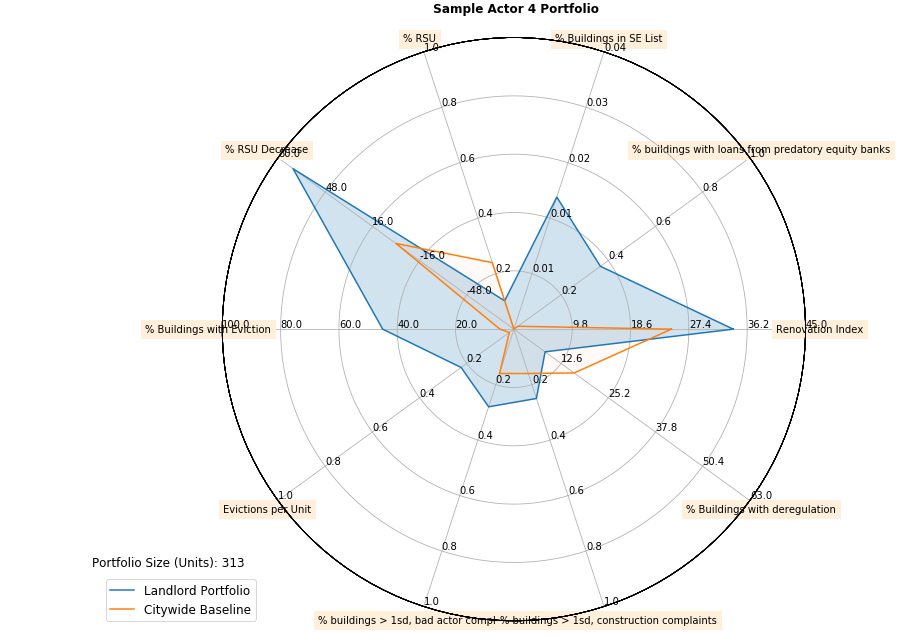
These indicators, when calculated for the portfolio of a given landlord, help facilitate a holistic understanding of a landlord's relationship with tenants. Information about the extent of a financial motive for deregulating units can be combined with indicators of predatory equity to generate an intuition about whether a landlord is a predatory equity investor focused on the deregulation of rent stabilized units (through coercion or otherwise). And this intuition can be synthesized with indicators showing the likelihood landlords are engaged in various tactics of tenant intimidation to get a sense of how landlords are treating tenants based on the financial incentives underlying this relationship.
To help motivate a more intuitive processing of these varied indicators, we created a radar chart with each indicator as one axis. City-wide baselines are visualized together with the portfolio-specific output to motivate an understanding of how much a portfolio is deviating from the city-wide norms of landlord behavior.
Bad landlord: Kushner
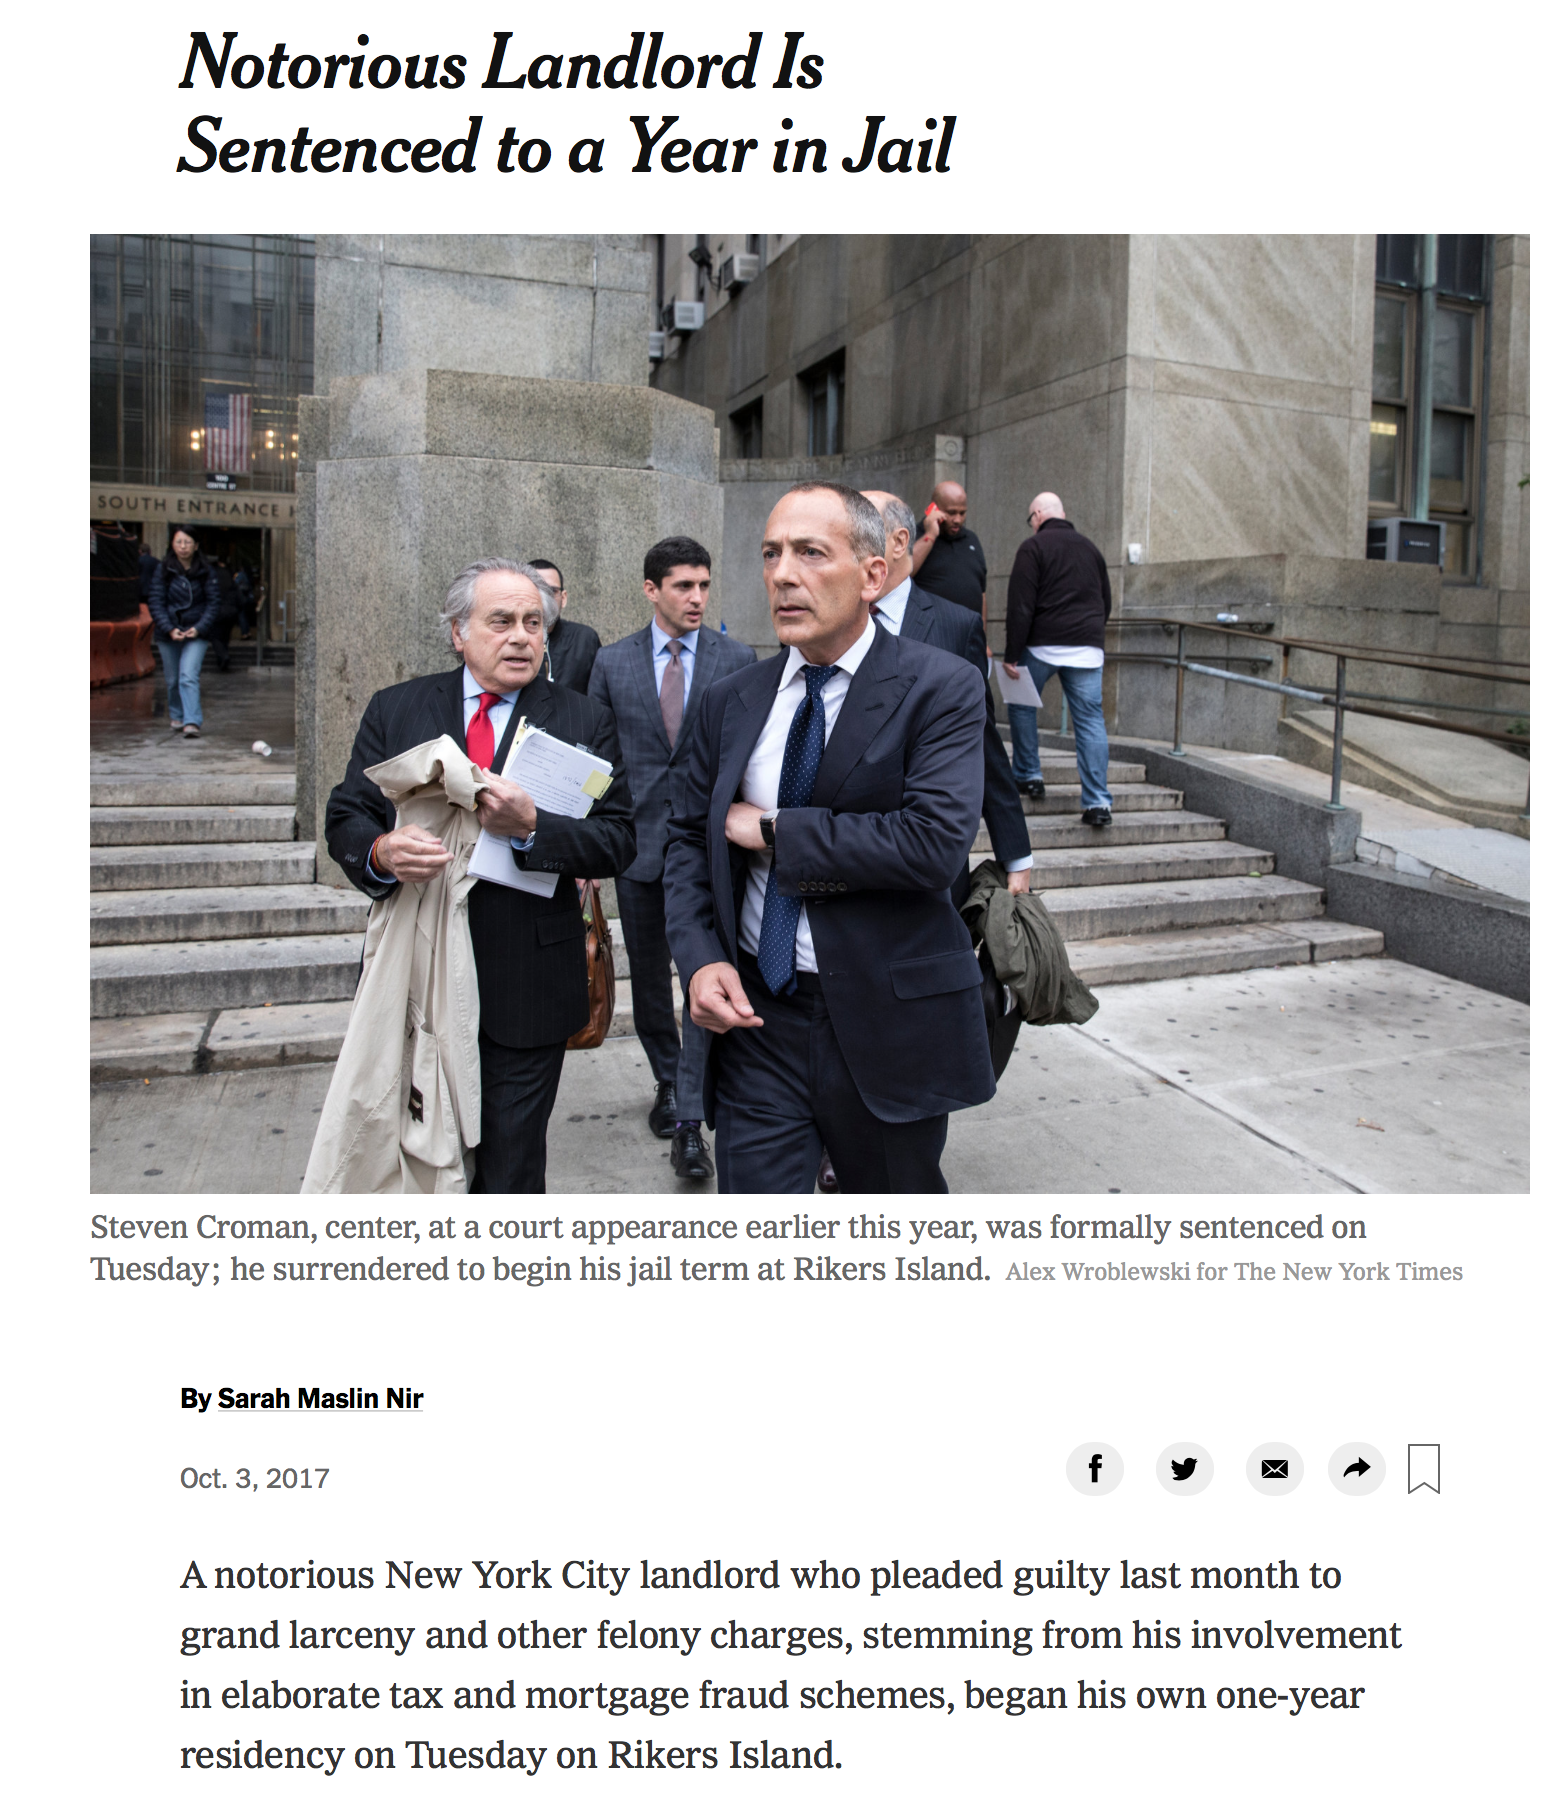
Bad landlord: Croman

Aenean ornare velit lacus, ac varius enim lorem ullamcorper dolore aliquam.
Feel free to contact us with any questions or requests!